Beta & Experimental Features
ROI Dashboard
BetaThe ROI Dashboard (the ROI tab in an event's Manage area) shows how an event paid off: revenue, what you actually spent, the net of the two, and ROI as a percentage, with a budget-versus-actual table by category, an optional year-over-year comparison and an optional net target.
Stage: included in GA
ROI Dashboard is listed as included in GA on Beta Features, so no switch is needed. The Outcomes section at the bottom of the page appears only when the separate Event ROI Outcomes feature is also on for your organization.
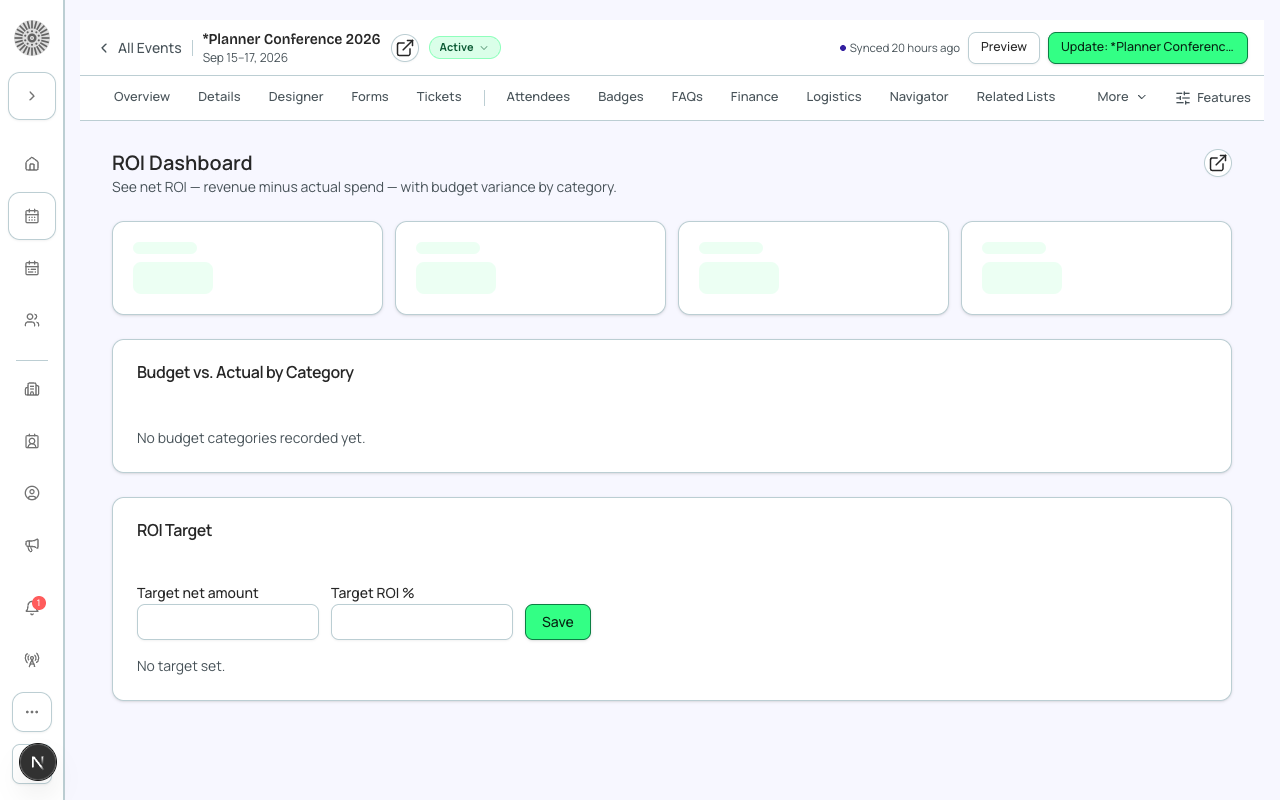
The four headline tiles
| Tile | How it is calculated | Recommendation |
|---|---|---|
| Revenue | The sum of the amounts of the payment transactions recorded against the event's orders in Salesforce. | If revenue looks low, check that payments are recorded as transactions on the event's orders, not only as order totals. |
| Actual Spend | The sum of Actual Amount across the event's budget expense lines (Finance > Budget). | Keep expense lines up to date and enter actuals as invoices arrive, otherwise ROI is overstated. |
| Net | Revenue minus Actual Spend. | Positive means the event covered its costs. |
| ROI | Net divided by Actual Spend, as a percentage. Shows a dash when Actual Spend is zero. Violet when zero or positive, red when negative. | A dash is expected until spend is entered; it does not mean 0%. |
Budget vs. Actual by Category
| Column | Meaning | Recommendation |
|---|---|---|
| Category | The budget category on your expense lines. | Use consistent categories so the table is readable. |
| Estimated | The planned amount for that category. | Set estimates in Finance > Budget before the event so variance means something. |
| Actual | The amount actually spent. | Compare to Estimated to see where the event ran over. |
| Variance | Estimated minus Actual. Positive means under budget; negative means over. | Look for the most negative rows first. |
Export CSV downloads the event's ROI figures as a CSV file. With no expense lines the table says "No budget categories recorded yet."
Year over year
When the event belongs to an event group that has an earlier edition, the Year over year card compares This edition with the Prior edition (the most recent earlier-starting event in the same group) for Revenue, Donations, Actual Spend, Registered and Attended, with the Change in the last column. A metric is hidden when either side has no value. If there is no group or no earlier edition the card says "No comparison data" rather than showing zeros.
To get a year-over-year comparison, put each yearly edition of the event in the same event group.
ROI Target
| Field | What it does | Recommendation |
|---|---|---|
| Target net amount | The net you want this event to reach. The page then shows "N% of target", calculated as Net divided by the target. | Set it to the surplus you promised stakeholders. Leave blank for no progress readout. |
| Target ROI % | The ROI percentage you aim for. It is saved with the event, but the progress line is calculated only from the net amount. | Fill it in to record the goal alongside the event. |
| Save | Saves both values. A blank field clears that value. | Save after changing either field. |
| Cancel | Appears once a target exists. Clears the saved target. | Use it to remove a target that no longer applies. |
Outcomes (Event ROI Outcomes)
When Event ROI Outcomes is on as well, an Outcomes section measures what attendees did after the event, such as opportunities created, gifts or enrollments, and shows converted counts, rate, amount, cost per conversion and an Outcome ROI. It says "Outcomes start after the event" before the event ends and "Maturing: day N of M" while the measurement window is still open. A contact's outcome can be credited to more than one event they attended. See the Event ROI Outcomes page for the outcome model settings.